


2025-07-11 (Fri) Market close
this is generated by AI via multiple sources, please treat this botcast as educational & entertainment purpose

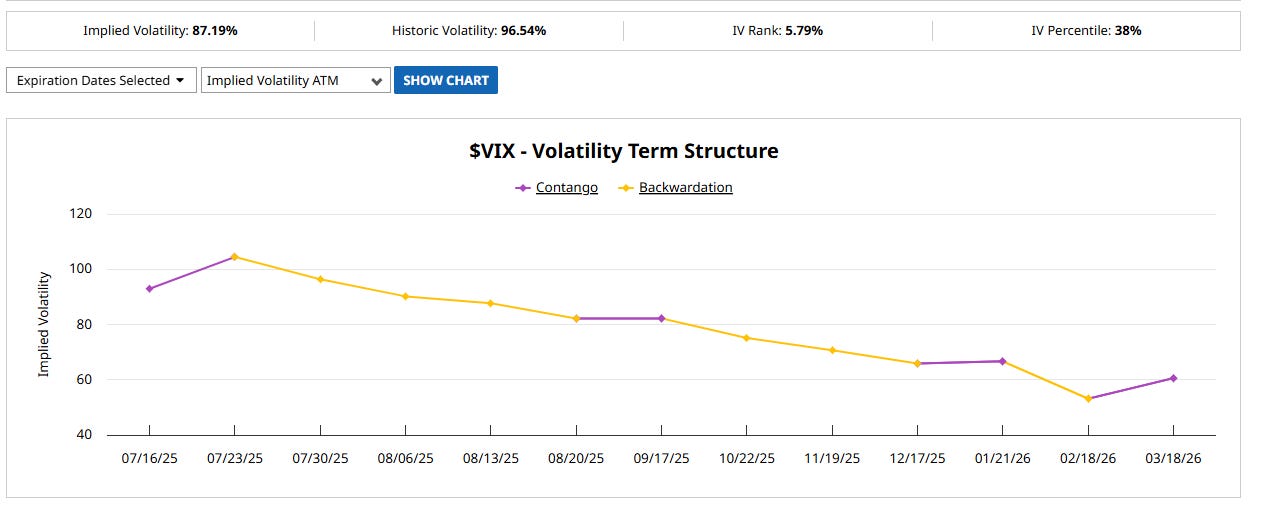
Market jittered from tariff escalation with canada. VIX was lifted pre-open and only died down towards US closing session. This is only intra-day noise for VIX Term structured as it is largely unchanged EOD. VVIX already rolling two weeks ahead already.


Source: Finviz
The market concluded the week with a negative sentiment, primarily driven by escalating trade war fears initiated by recent tariff announcements.
A. Key Market Movements and Trends from Today's Trading
Overall Market Performance: All three major US stock averages closed lower on Friday, pushing them into weekly losses.
Dow Jones Industrial Average: Fell 279.13 points (0.63%) to 44,371.51. It ended the week with a 1% decline.
S&P 500: Slid 0.33% to 6,259.75. It posted a weekly loss of 0.3%. The index had reached a new record high on Thursday before Friday's decline.
Nasdaq Composite: Ended the day 0.22% lower at 20,585.53. It recorded a weekly loss of 0.1%. This index also achieved a new record closing high on Thursday.
Sector Performance (Weekly):Leading Sectors: The energy sector led the S&P 500 with a 2.6% week-to-date gain. Industrials and information technology sectors also performed positively, both poised for a 0.6% gain. Consumer staples were on track for a 2% week-to-date gain.
Lagging Sectors: Financials and communication services stocks lagged, pacing for declines of 1.9% and 1.2% respectively.
Individual Stock Movements:Gainers:Levi Strauss: Rose 10% after exceeding second-quarter earnings and revenue expectations and increasing its dividend.
AeroVironment & Kratos Defense & Security: Gained 9.5% and 10.7% respectively, following a Pentagon order to fast-track drone production.
AMC: Popped nearly 10% after an upgrade to "outperform" from Wedbush, citing a more consistent release slate and completion of share issuance.
Tapestry, Dollar Tree, Coinbase, GE Vernova, TransDigm Group, ANSYS, NVIDIA, TE Connectivity: All hit new 52-week or all-time highs. Coinbase and MicroStrategy also saw gains as Bitcoin reached a new all-time high.
Laggards:Penn Entertainment: Dropped over 5% due to weak regional gaming revenue data in Iowa and Indiana.
Nike, Visa, Salesforce: Were the Dow's biggest laggards, falling 2.7%, 2.4%, and 1.8% respectively.
Tyson Foods, Molina Healthcare, PG&E: Traded at new 52-week lows.
Freeport-McMoRan: Downgraded to "neutral" by UBS, as the positive impact of copper tariffs was deemed largely priced in, following a 50% jump in shares over three months.
Cryptocurrency: Bitcoin extended its rally, topping $118,000 for the first time ever, after exchange-traded funds recorded their biggest day of inflows of 2025.
B. Analysis of the Main Economic Factors Driving Market Changes
Trade War Escalation: The primary driver of Friday's market downturn was the intensification of President Trump's trade war.
Canada Tariffs: Trump announced a 35% tariff on imported goods from Canada, citing fentanyl flow and alleged unfair trade practices. He threatened higher tariffs if Canada retaliates.
Blanket Tariffs: Trump also indicated plans for "blanket tariffs of 15% to 20% on remaining countries," significantly higher than the current 10% standard.
Other Tariffs: Earlier in the week, 50% U.S. tariffs on imported copper and Brazil were unveiled, along with 25% tariffs on South Korea and Japan.
Market Desensitisation (Barclays): Barclays noted that markets are becoming "increasingly de-sensitive to tariff threats," with this week's news resulting in "relatively 'less pain'" compared to previous sell-offs. However, they cautioned that "the impact on growth and inflation down the road is yet to be seen."
Upcoming Economic Data:
Second-Quarter Earnings Season: Kicks off next week, with major banks such as JPMorgan Chase, Wells Fargo, Citigroup, and Bank of New York Mellon reporting on Tuesday. This is expected to bring increased volatility.
Inflation Data (CPI): The release of June's consumer price index is looming large, with expectations of a 0.3% monthly rise. The Federal Reserve's June meeting minutes indicated concerns about inflationary pressure from tariffs.
Retail Sales: Bank of America forecasts a robust retail sales report for June, based on aggregated credit and debit card spending showing a 0.2% year-over-year increase, with growth across major categories.
Economic Cycle & Growth (Wolfe Research): Wolfe Research suggests the economy is in a "later cycle environment" with a "scarcity of secular growth." They believe investors will continue to "pay up for growth until they believe there is another cyclical upturn in the U.S. economy." Most companies expected to grow revenues over 10% this year are in the technology or communication services sectors.
Regional Bank Valuations (Piper Sandler): Piper Sandler cautioned that the recent rebound in regional banks might be "overdone," despite a solid fundamental backdrop. Earnings reports next week will test this strength.
C. Geopolitical Events Affecting Financial Markets
US-Canada Trade Relations: The imposition of a 35% tariff on Canada by President Trump, citing fentanyl and "unfair trade practices," has significantly heightened trade tensions between the two countries. Canada's Prime Minister Mark Carney responded on X, highlighting progress in combating fentanyl and a commitment to continued cooperation.
Broader Trade Policy: Trump's announcement of impending blanket tariffs of 15% to 20% on "all of the remaining countries" signals a significant shift in U.S. trade policy and a potential expansion of global trade conflicts. This includes surprise announcements of tariffs on Vietnam and Brazil.
EU Tariff Uncertainty: Traders awaited an update from Trump regarding European Union tariffs, but none came during market hours, adding to uncertainty about ongoing trade talks.
D. Forward-Looking Insights and What Investors Should Watch
Earnings Season: Investors should closely monitor the start of the second-quarter earnings reporting season next week, particularly from major banks. This period is expected to increase market volatility.
Inflation Data: The upcoming release of June's Consumer Price Index (CPI) will be a key indicator for investors, influencing expectations for Federal Reserve policy.
Trade War Developments: The ongoing rhetoric and implementation of tariffs by the US administration will remain a critical factor. Investors should watch for any retaliatory measures from affected countries and further announcements regarding new tariffs or trade deals.
Federal Reserve Policy: While Fed fund futures indicate a slim chance of a rate cut in July, easing in September is considered likely. The impact of tariffs on inflation will be a key consideration for future interest rate decisions.
Sectoral Opportunities: Despite broader market declines, some sectors, like energy and technology, have shown resilience. Investors may look for growth opportunities within these areas, although Wolfe Research cautions on the scarcity of secular growth.
Regional Banks: The upcoming earnings reports from regional banks will provide crucial insights into their valuations and potential for further rebound.
Eco to watch:

Source: Trading Economics
Today Signal PnL feedback: Not as strong signal heading into end of week (and also next week expiry). Market is still trying to push up, but the head room is getting less. VVIX ticked up a bit
Entry price reference: 16.87 or higher (spread 2.24 or lower)
UX1 Indicative range : Low - High (Jul) 16.64 - 17.2 (spread 2.15 - 2.31)
Stop loss: 17.1 30 mins after US open (or 17.5 hard stop and spread out as well)
Profit take: 16.3 any time thru out the day
Hard SL 17.5 was touched in early pre-trade US session and spread out 1.95. Big step back
Move and PnL (**excl commission and slippage**)
25-07-11 cl : Short VIX (SL 17.5)+ Long Spread (SL 1.95) , UX1 -0.08 , UX1UX2 +0.07, MTD net -($10) pnl
25-07-10 cl : Short VIX (TP 17)+ Long Spread (TP 2.25) , UX1 -0.08 , UX1UX2 +0.07, MTD net +$910 pnl
25-07-09 cl : Short VIX (TP 17.6)+ Long Spread (TP 1.9) , UX1 -0.42 , UX1UX2 +0.1 , MTD net +$760 pnl
25-07-08 cl : No positions, MTD net +$240 pnl
25-07-07 cl : Short VIX (SL 19)+ Long Spread, UX1 +0.6 , UX1UX2 -0.21 , MTD net +$240 pnl
25-07-03 cl : Short VIX (TP 18)+ Long Spread, UX1 -0.56 , UX1UX2 +0.1 , MTD net +$1,050 pnl
25-07-02 cl : Long VIX (TP 18.85), UX1 +0.20, MTD net $390 pnl
25-07-01 cl : Long VIX (TP 18.9), UX1 +0.19, MTD net $190 pnl
**Accum model
2025 YTD net +$9,710 pnl
2024 FY net +$40,005 pnl
2023 H2 net +$10,690 pnl
** multiplier USD$1000, assume 1 contract size (i.e. Short = -1 UX1, Long spr = -1 UX1 & 1 UX2, Long Vix = +1 UX1, No Action means no Positions). Margin indicative consumption: USD$22,000 for short or long + USD$10,000 for long spr = USD$32,000**
//Model signal apply from today US MARKET EOD GMT 4pm to next US MARKET EOD GMT 4pm for VIX future positions///
View this at your own risk. Historical performance does not serve as a dependable predictor of future performance. Material in this page comes from many sources and may be inaccurate or incomplete. This page does not warrant the completeness, accuracy or timing of any information herein. This is not an offer to buy or sell securities. Information or opinions on this page are presented solely for educational and entertainment purposes, and are not intended nor should they be construed as investment advice.
To plan ahead~~
14 Jul 2025 (Mon) Action SIGNAL :
SHORT VIX + LONG SPREAD

Vixbot Signal comment: Still try to keep up the Vol crush phrase, however as getting close to expiry. Dont put too much risk
Entry price reference: 17.12 or higher (spread 2.07 or lower)
UX1 Indicative range : Low - High (Jul) 16.58 - 17.61 (spread 1.89 - 2.27)
Stop loss: 17.4 30 mins after US open (or 17.7 hard stop and spread out as well)
Profit take: 16.6 any time thru out the day
15 Jul 2025 (Tue) Action SIGNAL : SHORT VIX + LONG SPREAD
Vixbot Signal comment: 50/50 short, may set for tight stop loss again before the new future

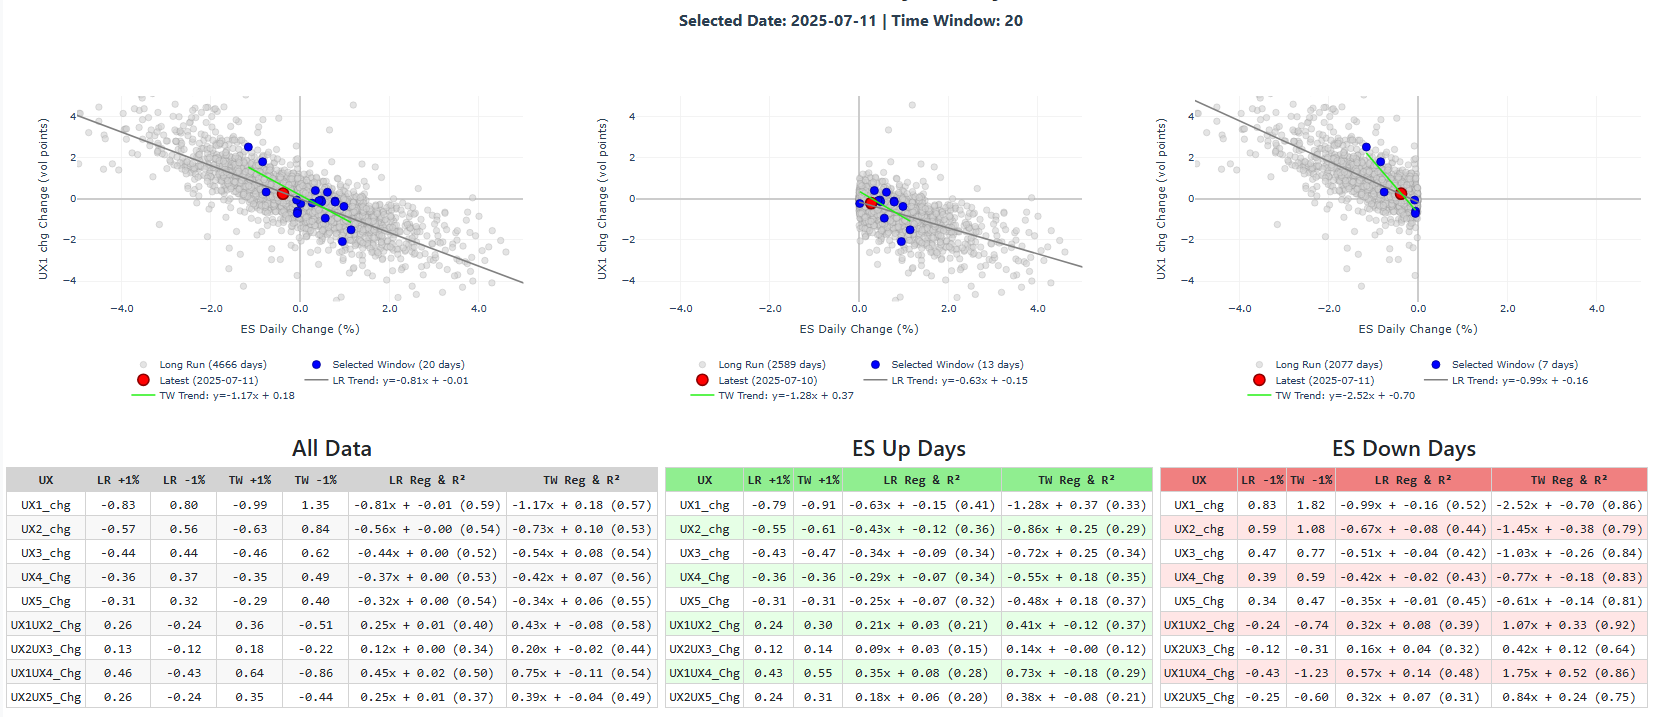
Some facts sharing, if we going back to a 20-30 VIX spot range, then expect ES to have a +/- 3% to 4% move. This align with the EMA average True Range as % to ES as well.